A scatterplot describes datapoints relating two variables. (see p. 224)
We look for:
- overall patternTwo variables are positively correlated if they grow bigger together.- form- deviations, in particular
- direction
- strength of relationship- outliers
examples:
height - weight
weight of vehicle - gas mileage
length of name - head circumference
height above sea level - temperature
A regression line - line that
describes
how variable y changes as variable x changes.
(Can you draw an approximation line through the data points in the
scatter plot? How good an approximation is it?)
see p. 227
line equation: y = ax + b,
where a = slope,
b = y-intercept
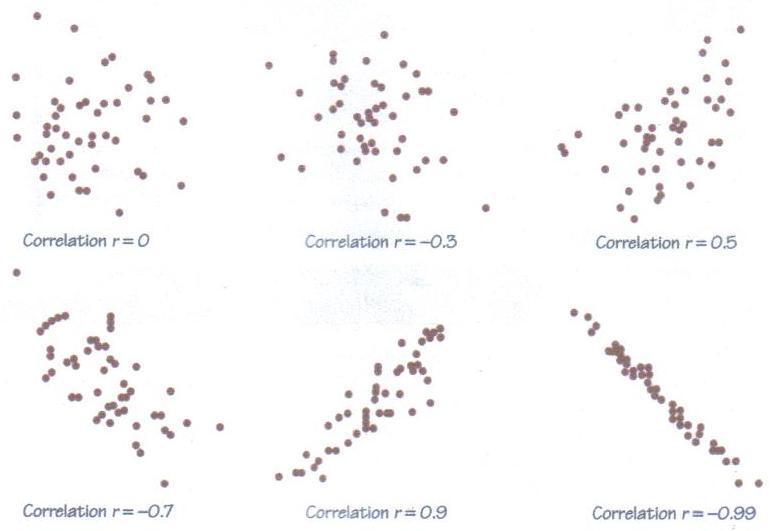
The correlation r is a number between -1 and 1:
r > 0 positively correlated
r < 0 negatively correlated
|r| close to 1 strongly correlated, i.e. points lie close to a line or on it.
|r| close to 0 weakly correlated, i.e. points lie scattered, line not very discernible
r = 0 no straight line relationship
Computing r:
Given data points (x1, y1), ,
(xn,
yn), means mx , my and standard
deviations sx , sy.
Then
r = 1/(n-1) [(x1 - mx)(y1 - my)/sxsy + ... + (xn - mx)(yn - my)/sxsy]
the least squares regression line: y = ax + b,
where a = r * (sy / sx)Archeopterix example:and b = my - a mx
| Femur length x | 38 | 56 | 59 | 64 | 74 |
| Humerus length y | 41 | 63 | 70 | 72 | 84 |
| x | 1 | 1 | 4 | 5 | 6 | 7 | 8 | 9 |
| y | 1 | 3 | 1 | 4 | 2 | 3 | 1 | 2 |
compute the correlation
a) add an outlier (x,y) = (30,40) as a data value to the above list
compute the correlation,
compute the correlation,
Correlation does not imply
causation.
Examples:
ice cream parlor next to public pool does a business in summer:In the law:
underlying cause: heat in summer causes both crowds at the pool and the icecream parlor.child is ill with fever and a bad cough. Treatment with Tylenol doesn't work.
Obviously, fever and cough are related. Fever is the bodies reaction to fight a disease whose other symptom is cough.
One such disease is pneumonia, the underlying cause.
So it's not enough to treat the symptoms, one has to treat the disease.
possible cause is indicated by a correlation, which leads to investigation
probable cause is given, when the correlation involves cause, which is needed for a warrant or a wiretap
cause beyond reasonable doubt: found a physical model explaining the situation. Usual standard for conviction.