r=[0:1/2^5:1]';
theta=[0:1/2^6:1]*2*pi;
i=sqrt(-1);
z=r*exp(i*theta);
x=real(z); y=imag(z);
w=z.^2; u=real(w); v=imag(w);
figure(1), cplxmap(z,w)
colormap(jet)
help cplxmap
xlabel('x'), ylabel('y'), title('w=z^2')
caxis([-1 1]), colorbar
figure(2), contourf(x,y,u), axis image, xlabel('x'), ylabel('y'), title('contours of u=real(z^2)')
colorbar
figure(3), contourf(x,y,v), axis image, xlabel('x'), ylabel('y'), title('contours of v=imag(z^2)')
colorbar
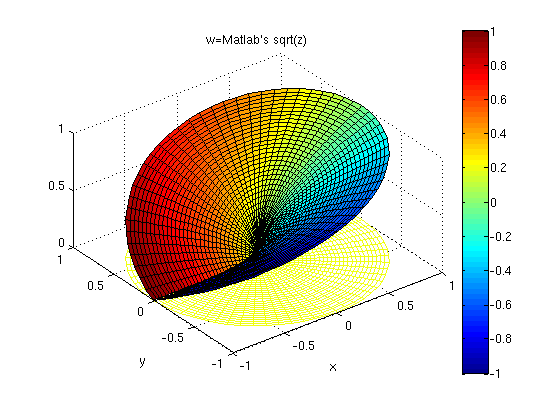
figure(4), cplxmap(z,sqrt(z))
colormap(jet)
xlabel('x'), ylabel('y') , title('w=Matlab''s sqrt(z)')
caxis([-1 1]), colorbar, axis image
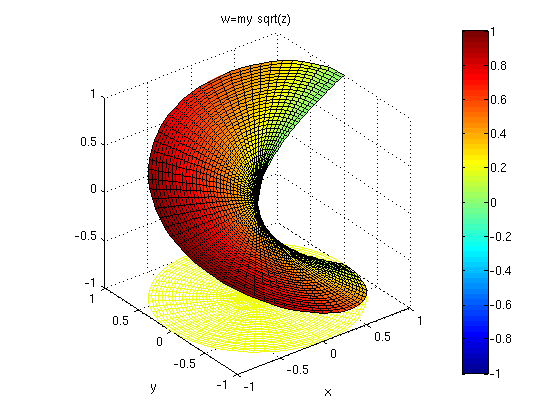
myrtz=sqrt(r)*exp(i*theta/2);
figure(5), cplxmap(z,myrtz)
colormap(jet)
xlabel('x'), ylabel('y'), title('w=my sqrt(z)'), axis image
caxis([-1 1]), colorbar
theta2=[0:1/2^6:2]*2*pi; z2=r*exp(i*theta2);
figure(6), cplxmap(z2,sqrt(r)*exp(i*theta2/2))
colormap(jet)
xlabel('x'), ylabel('y'), title('w such that w^2=z'), axis image
caxis([-1 1]), colorbar
 CPLXMAP Plot a function of a complex variable.
    CPLXMAP(z,f(z),(optional bound))
    Used by CPLXDEMO.

    See also CPLXGRID.